
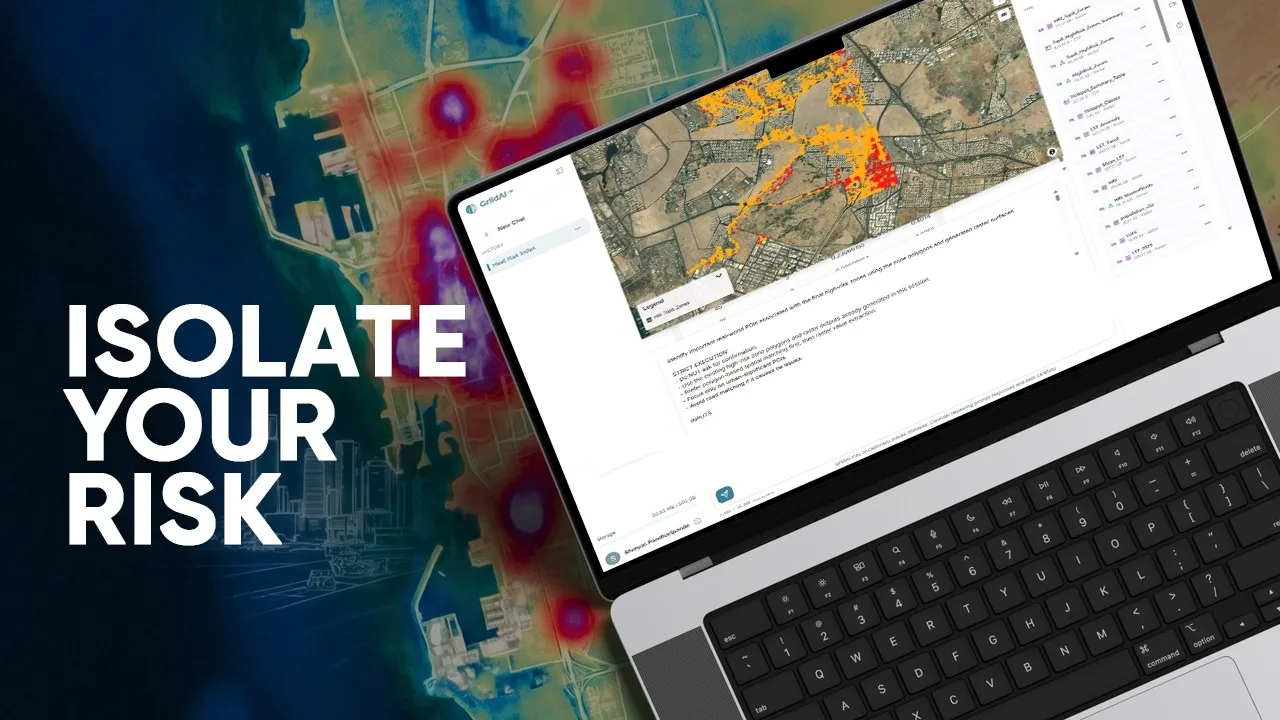
Where do heat exposure, population sensitivity and limited cooling capacity overlap?
The Jeddah demonstration brings together Landsat surface-temperature history, ESA WorldCover and WorldPop. It describes checks on resolution, alignment and coordinate systems before the analytical layers are combined.
The index represents heat exposure, adaptive capacity and population sensitivity. Its mapped patterns support examination of heat-priority areas and discussion of measures such as shade, vegetation and reflective surfaces.
Source video
Watch the example
Full demo
Watch on YouTube (opens in a new tab)Mapping Urban Heat Risk Without Coding | GriidAI Workflow Demo
From question to analysis
Data and inputs
- Surface-temperature observations and a defined historical period
- Land cover describing built-up and vegetated areas
- Population distribution and a common analysis grid
Analysis described in the video
- Inspect the input periods, resolution and coordinate systems.
- Develop temperature, land-cover and population indicators on a common grid.
- Normalize and combine the indicators into the stated heat-risk index.
- Map the index and examine priority clusters with local context.
Understand the output
Outputs described
- Heat-risk raster and priority-area map
- Evidence to support review of possible mitigation locations
What to review
- Distinguish land-surface temperature from direct human heat exposure.
- Review indicator weights and population redistribution assumptions.