
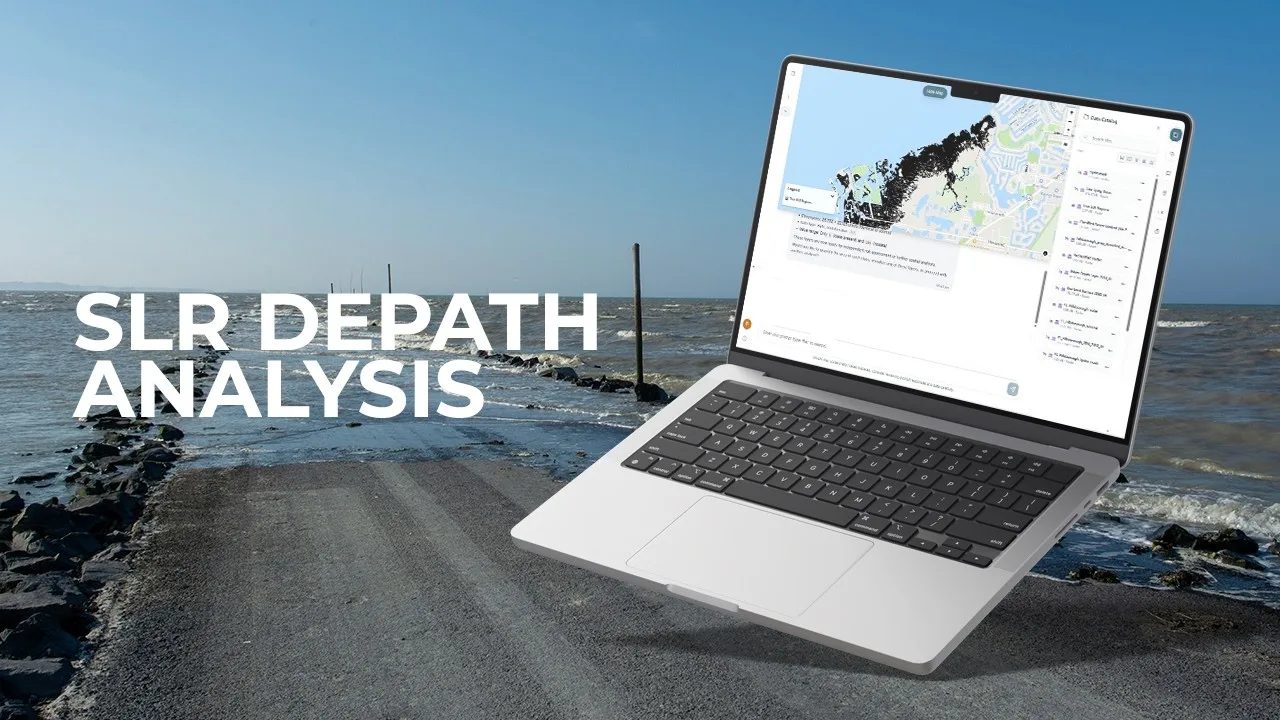
Which coastal areas connect to the ocean under a defined water-level scenario?
This demonstration starts with elevation and hydrological information to examine sea-level-rise scenarios. Its central distinction is between land that is simply low and land connected to ocean-driven flooding.
The described sequence cleans waterbody inputs, applies hydrological masking and converts raster results into vector layers. Reprojection and GeoParquet export prepare the output for mapping and subsequent analysis.
Source video
Watch the example
Full demo
Watch on YouTube (opens in a new tab)Sea Level Rise Analysis in Minutes —No-Code GeoAI with GriidAi
From question to analysis
Data and inputs
- Elevation data with known units and vertical reference
- Waterbody and coastal-connectivity information
- A study area and an explicit water-level scenario
Analysis described in the video
- Inspect elevation, spatial references and the chosen scenario.
- Prepare waterbody data and distinguish coastal connectivity from inland depressions.
- Derive the scenario result and inspect the inundation boundaries.
- Convert and export the mapped layers for further analysis.
Understand the output
Outputs described
- Scenario-based coastal inundation layers
- Vector outputs suitable for maps and exposure summaries
What to review
- Check elevation quality, vertical reference and connectivity assumptions.
- Treat the result as a defined scenario, rather than a forecast of a particular storm.