
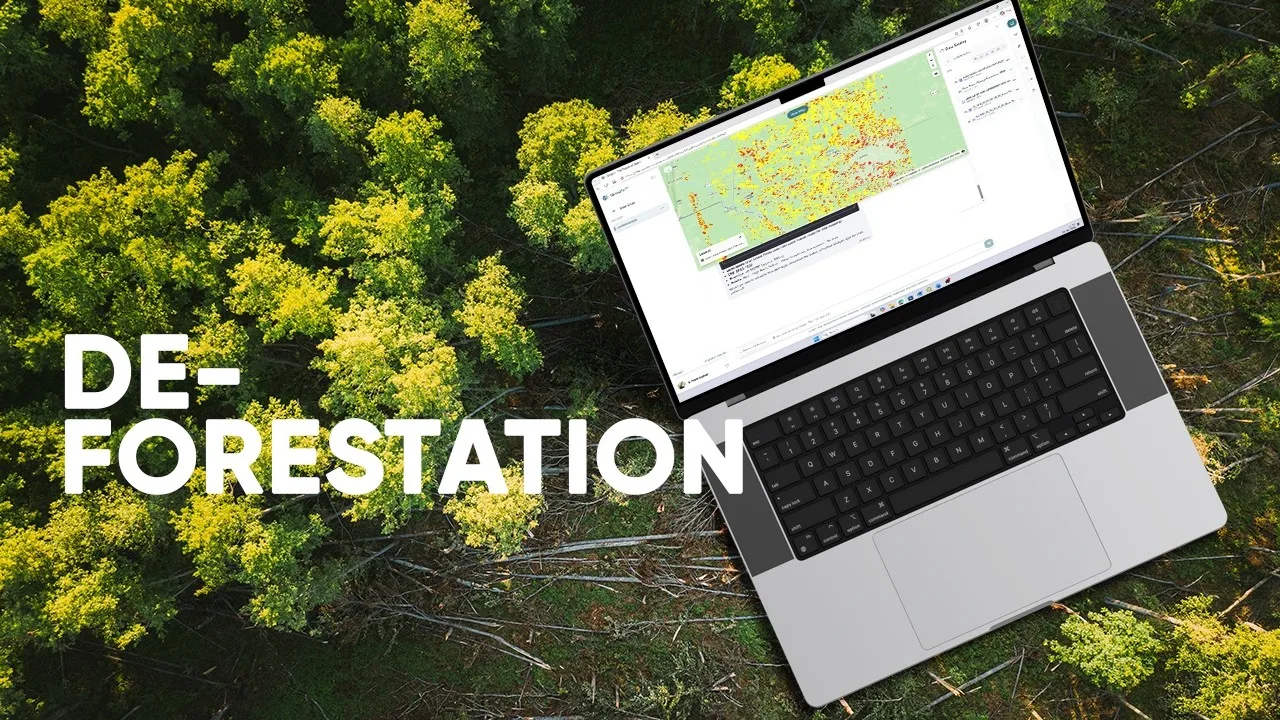
Where has forest cover changed, and what land-cover classes replaced it?
The video follows land-cover changes between 1992 and 2022. It uses class metadata to translate raster codes into named land-cover categories, making changes easier to interpret.
After aligning the data, the analysis builds transition summaries and distinguishes forest-to-cropland change from other forest-loss pathways. Mapped classes and tabular exports keep the geography connected to the quantitative result.
Source video
Watch the example
Full demo
Watch on YouTube (opens in a new tab)Mapping 30 Years of Deforestation in 10 Minutes | GriidAi Workflows
From question to analysis
Data and inputs
- Categorical land-cover rasters for the comparison dates
- Class definitions and metadata
- A study boundary and an area-calculation reference system
Analysis described in the video
- Inspect the dates, class definitions and spatial alignment.
- Identify forest classes and compare them with the later land-cover categories.
- Calculate transitions and summarize their areas or proportions.
- Map the different loss pathways and export the results.
Understand the output
Outputs described
- Forest-loss maps separated by destination class
- Land-cover transition summaries and exportable tables
What to review
- Check that class definitions are comparable across dates.
- Review alignment and area units before interpreting change totals.