
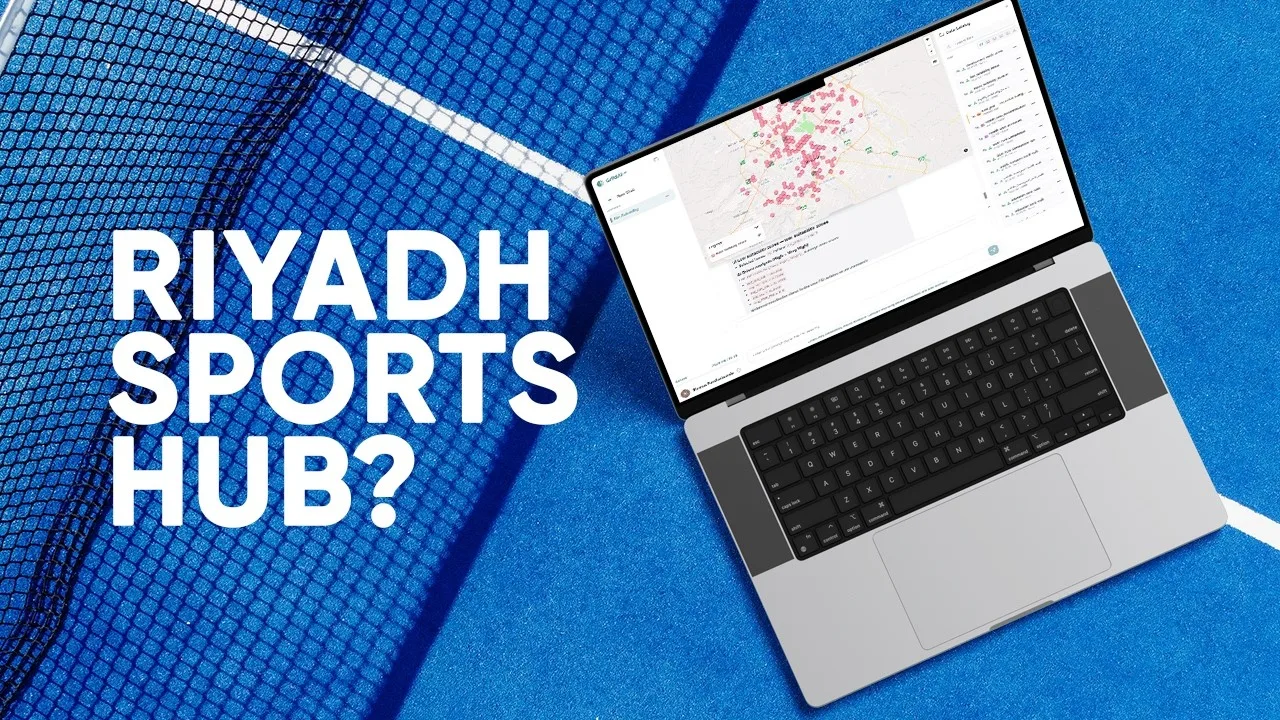
Where could new sports centers best serve Riyadh?
The Riyadh demonstration combines several location factors in a common hexagonal grid. Demographics describe potential demand, while transport access, commercial activity and nearby competitors add context to each candidate area.
The video describes a suitability index built from normalized indicators, then groups high-scoring cells into development clusters. The result is a transparent shortlist for review, with individual indicators behind each score.
Source video
Watch the example
Full demo
Watch on YouTube (opens in a new tab)AI-Assisted Site Suitability Modeling: Locating Sports Centers in Riyadh | GriidAI
From question to analysis
Data and inputs
- Population and demographic layers; nighttime-light data
- Public services, transport stops, shopping malls and existing gyms
- Building density, land cover and elevation
Analysis described in the video
- Define the study area and organize the city into comparison cells.
- Build indicators for demand, commercial activity, accessibility and competition.
- Review land-cover and terrain constraints, then normalize the selected indicators.
- Combine the indicators and examine the resulting high-scoring clusters.
Understand the output
Outputs described
- Suitability map and candidate development clusters
- Indicator values explaining each candidate score
What to review
- Review how weights and thresholds affect the ranking.
- Check that access, population and competitor data represent the same geography and relevant period.